1
2
3
4
5
6
7
8
9
10
11
12
13
14
15
16
17
18
19
20
21
22
23
24
25
26
27
28
29
30
31
32
33
34
35
36
37
38
39
40
41
42
43
44
45
46
47
48
49
50
51
52
53
54
55
56
57
58
59
60
61
62
63
64
65
66
67
68
69
70
71
72
73
74
75
76
77
78
79
80
81
82
83
84
85
86
87
88
| import matplotlib.pyplot as plt
import numpy as np
xdata = [8., 3., 9., 7., 16., 05., 3., 10., 4., 6.]
ydata = [30., 21., 35., 27., 42., 24., 10., 38., 22., 25.]
plt.cla()
w_init = 2.
b_init = 60.
w_change = [w_init]
b_change = [b_init]
def grad(w, b):
w_grad = 0
b_grad = 0
for i in range(len(xdata)):
y_pred = w * xdata[i] + b
w_grad += float(2 * (ydata[i] - y_pred) * (-xdata[i]))
b_grad += float(2 * (ydata[i] - y_pred) * (-1))
return w_grad, b_grad
def loss(w, b):
res = 0
for i in range(len(xdata)):
y_pred = w * xdata[i] + b
res += pow(ydata[i] - y_pred, 2)
return res/10
def gradient_descent(w_pred, b_pred, learning_rate=0.001, iter=10000):
for i in range(iter):
lossf = loss(w=w_pred, b=b_pred)
print("range " + str(i) + ": loss = " + str(lossf))
gradf = grad(w=w_pred, b=b_pred)
w_pred = float(w_pred - learning_rate * gradf[0])
b_pred = float(b_pred - learning_rate * gradf[1])
w_change.append(w_pred)
b_change.append(b_pred)
return w_pred, b_pred
print("data set:")
print(xdata)
print(ydata)
plt.figure(1)
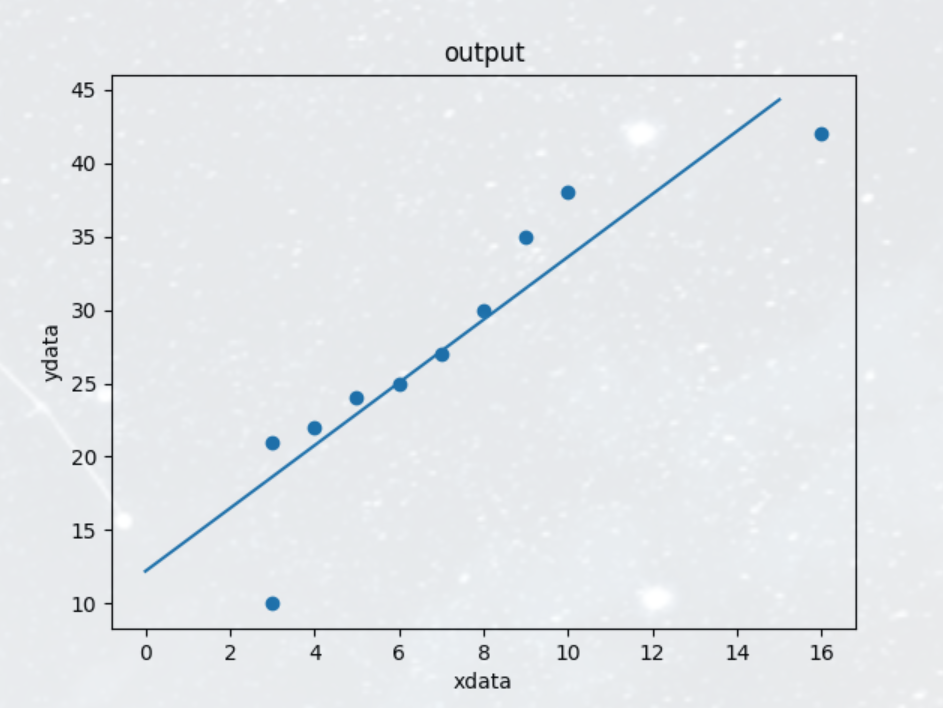
plt.scatter(xdata, ydata)
plt.title("output")
plt.xlabel("xdata")
plt.ylabel("ydata")
print("initial input:")
print("w = " + str(w_init))
print("b = " + str(b_init))
learning_rate = 0.001
iter = 10000
print("Linear Regression: learning_rate = " + str(learning_rate) + ",iteration = " + str(iter))
res = gradient_descent(w_pred=w_init, b_pred=b_init, learning_rate=learning_rate, iter=iter)
print("result: w_pred = " + str(res[0]) + ", b_pred = " + str(res[1]))
x = np.arange(0, 16)
y = res[0] * x + res[1]
plt.plot(x, y)
plt.show()
plt.figure(2)
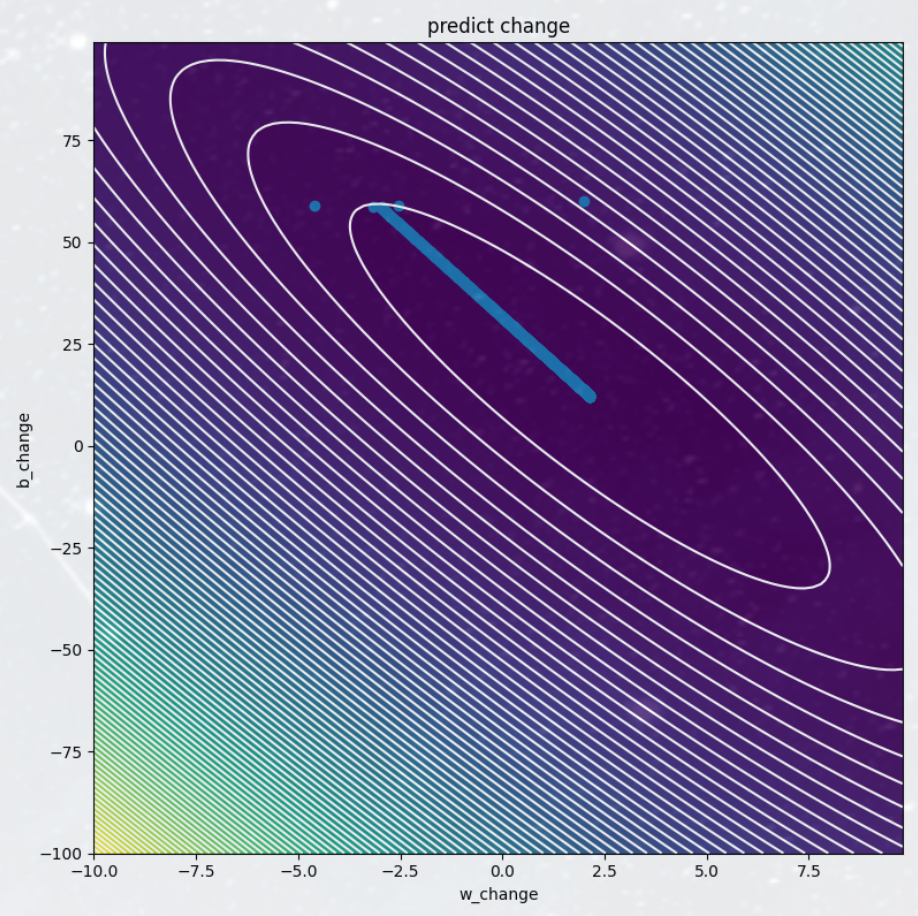
x = np.arange(-10,10,0.2)
y = np.arange(-100,100,1)
X,Y = np.meshgrid(x,y)
Z = loss(X, Y)
fig, ax = plt.subplots(figsize=(8,8),dpi=100)
CS = ax.contourf(X, Y, Z, 100)
CS = ax.contour(X, Y, Z, 100, colors='white')
plt.scatter(w_change,b_change)
plt.title("predict change")
plt.xlabel("w_change")
plt.ylabel("b_change")
plt.tight_layout()
plt.show()
|


